Prediction of Buildings Energy Consumption
Bin Yan, Constant Wette and Wen Xie
Exploratory Data Analysis
Electricity consumption pattern
Electricity shows a strong periodical pattern. You can clearly see the difference between day and night, weekdays and weekends.

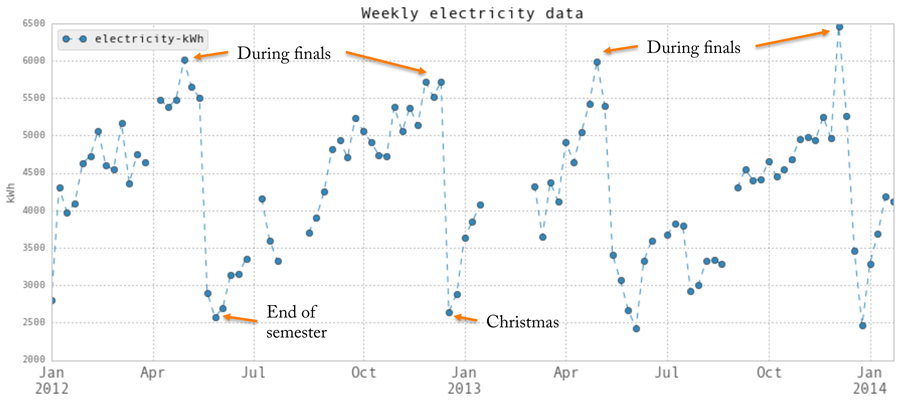
It looks like during each semester, electricity use ramps up toward a peak at finals, perhaps representative of studying patterns. The students are working harder and harder toward finals. Then there is a dip after semesters end, inlcuding Christmas vacation. The electricity consumption is relatively low during January and summer terms, and spring break, when campus can be relatively empty. (Text partially contributed by Steven)

Relationship between Energy Consumption and Features
Electricity is not co-related with weather data (temperature). The idea of using weather information to predict electricity will NOT work. I think it mostly depends on time/occupancy. But we can still do some pattern exploration to figure out day/night, weekday/weekend, school day/holiday electricity consumption pattern. Actually, we should have noticed that from monthly data.
Chilled water and steam are strongly co-related with temperature and humidity. Daily chilled water and steam consumption have a good linear relationship with cooling and heating degrees. Even simple linear regression might be already quite accurate. However, using with weather information to predict hourly chilled water and steam is not suffient.

More details can be found in